RSI vs Stochastic RSI: Momentum Made Simple
RSI vs Stochastic RSI: Momentum Made Simple
When we talk about trading, momentum is very important. Two popular tools for measuring momentum are RSI and Stochastic RSI. Both help traders make decisions. Let’s learn about them!
What is RSI?
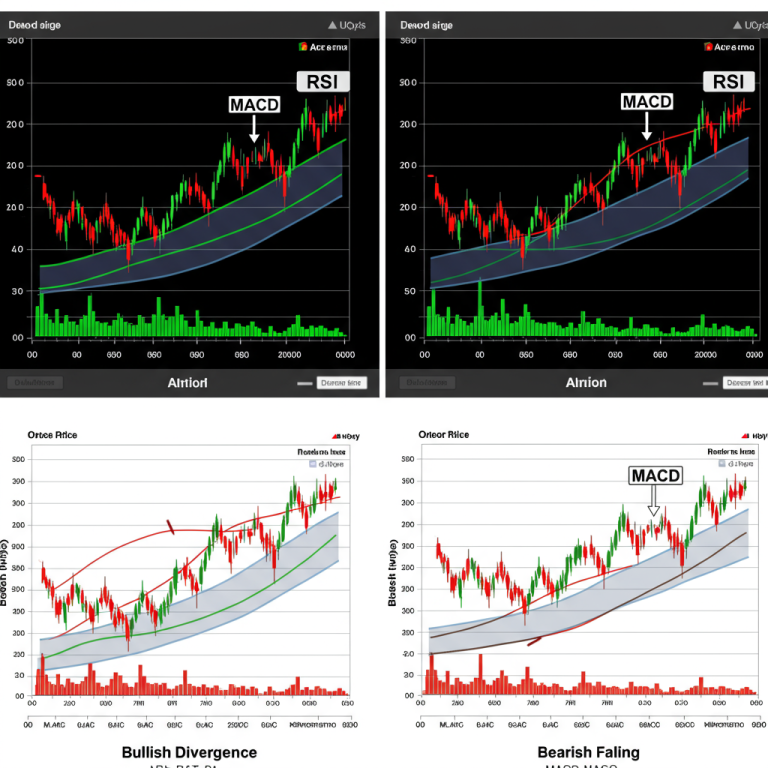
RSI stands for Relative Strength Index. It is a tool that shows if a stock is overbought or oversold. The RSI value goes from 0 to 100. Generally, an RSI above 70 means a stock is overbought. An RSI below 30 means it is oversold.
How to Use RSI
Traders use RSI to find good buying and selling points. If the RSI is high, it might be a good time to sell. If the RSI is low, it might be a good time to buy. It helps traders avoid making bad choices.
What is Stochastic RSI?
Stochastic RSI is a variation of the RSI. It uses the RSI value to find momentum. Stochastic RSI also goes from 0 to 1. It helps traders see if the RSI is overbought or oversold.
How to Use Stochastic RSI
Traders use Stochastic RSI in a similar way to RSI. If the Stochastic RSI is above 0.8, it might be overbought. If it is below 0.2, it might be oversold. This helps traders find the best times to buy or sell.
RSI vs Stochastic RSI Comparison
| Feature | RSI | Stochastic RSI |
|---|---|---|
| Range | 0 to 100 | 0 to 1 |
| Overbought Level | Above 70 | Above 0.8 |
| Oversold Level | Below 30 | Below 0.2 |
| Calculation | Based on price changes | Based on RSI values |
When to Use Each Tool
Both RSI and Stochastic RSI are useful. However, they work best in different situations. Here are some tips on when to use each tool:
- Use RSI for longer trends.
- Use Stochastic RSI for short-term trades.
- Combine both for better results.
Conclusion
Understanding RSI and Stochastic RSI is important for traders. Both tools help measure momentum. They can guide you in making better trading decisions.
FAQ
What is the main difference between RSI and Stochastic RSI?
The main difference is how they measure momentum. RSI uses price changes, while Stochastic RSI uses RSI values.
Can I use RSI and Stochastic RSI together?
Yes, using both can give you better trading signals. They can confirm each other’s readings.
What are the best levels for RSI and Stochastic RSI?
For RSI, over 70 is overbought and under 30 is oversold. For Stochastic RSI, over 0.8 is overbought and under 0.2 is oversold.
RSI and Stochastic RSI are helpful tools for understanding market momentum.