Divergence 101: Hidden vs Regular on RSI & MACD
Divergence 101: Hidden vs Regular on RSI & MACD
Divergence is an important concept in trading. It helps traders understand market trends. In this article, we will learn about two types of divergence: hidden divergence and regular divergence. We will also look at two popular tools: RSI and MACD.
What is Divergence?
Divergence happens when the price of an asset moves in a different direction than an indicator. This can show that a trend may change. Traders watch for divergence to make better decisions.
Types of Divergence
There are two main types of divergence: regular and hidden. Each type gives different signals. Let’s look at them closely.
Regular Divergence
Regular divergence happens when the price makes a new high or low. However, the indicator does not follow this trend. This can mean that the current trend is losing strength.
- If the price makes a new high but the indicator does not, it signals a possible downtrend.
- If the price makes a new low but the indicator does not, it signals a possible uptrend.
Hidden Divergence
Hidden divergence is different. It occurs when the price does not make a new high or low, but the indicator does. This can show that the current trend will continue.
- If the price makes a higher low and the indicator makes a lower low, it signals a continuation of the uptrend.
- If the price makes a lower high and the indicator makes a higher high, it signals a continuation of the downtrend.
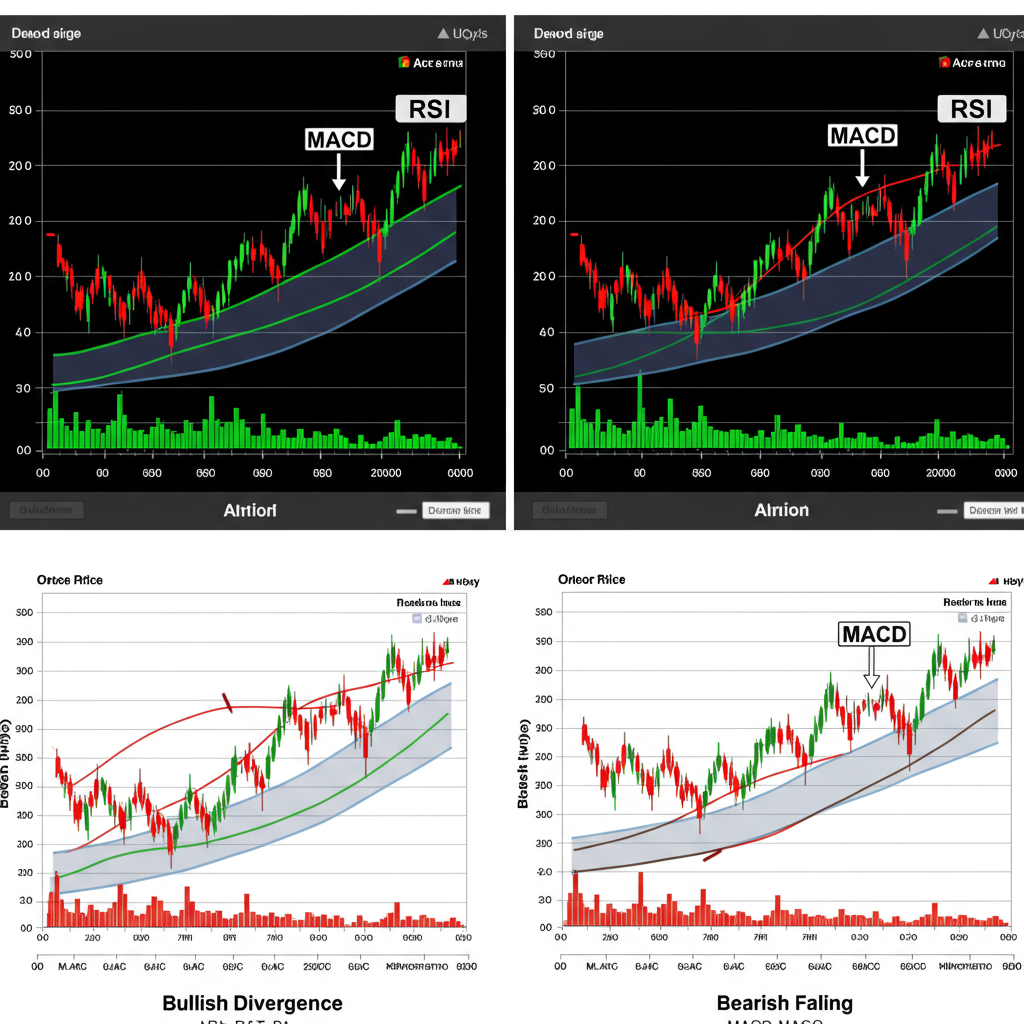
Understanding RSI and MACD
RSI and MACD are tools that traders use to find divergence. Let’s see what they are and how they work.
What is RSI?
RSI stands for Relative Strength Index. It measures the speed and change of price movements. RSI values range from 0 to 100. A value above 70 means an asset may be overbought, while a value below 30 means it may be oversold.
What is MACD?
MACD stands for Moving Average Convergence Divergence. It shows the relationship between two moving averages of an asset’s price. MACD has three parts: the MACD line, the signal line, and the histogram. Traders use these to spot trends and possible reversals.
Comparison of RSI and MACD
| Feature | RSI | MACD |
|---|---|---|
| Type of Indicator | Momentum Indicator | Trend Indicator |
| Value Range | 0 to 100 | No specific range |
| Signals | Overbought/Oversold | Crossovers and Divergence |
| Best Used For | Short-term trades | Long-term trends |
How to Spot Divergence
To spot divergence, follow these steps:
- Choose an asset to analyze.
- Select either RSI or MACD as your indicator.
- Look for price movements and compare them to the indicator.
- Identify if there is regular or hidden divergence.
- Make decisions based on your findings.
Why is Divergence Important?
Divergence helps traders predict market movements. It can show when to buy or sell an asset. Understanding divergence can give traders an edge in the market.
Conclusion
In summary, divergence is a key concept in trading. Regular and hidden divergence can provide important signals. Using tools like RSI and MACD can help traders identify these divergences. Learning about these concepts can improve your trading skills.
FAQ
What is the main difference between regular and hidden divergence?
Regular divergence signals a possible trend change, while hidden divergence signals a trend continuation.
How do I use RSI to find divergence?
You can use RSI to compare price movements with the RSI line. Look for differences in direction.
Can I use MACD for short-term trades?
MACD is generally better for long-term trends, but it can be used for short-term trades with caution.
Divergence is a useful tool for traders to understand market trends.